10 KiB
Configuring OpenTelemetry Demo App with SigNoz
The OpenTelemetry Astronomy Shop is an e-commerce web application, with 15 core microservices in a distributed system which communicate over gRPC. Designed as a polyglot environment, it leverages a diverse set of programming languages, including Go, Python, .NET, Java, and others, showcasing cross-language instrumentation with OpenTelemetry. The intention is to get a quickstart application to send data and experience SigNoz firsthand.
This guide provides a step-by-step walkthrough for setting up the OpenTelemetry Demo App with SigNoz as backend for observability. It outlines steps to export telemetry data to SigNoz self-hosted with Docker, SigNoz self-hosted with Kubernetes and SigNoz cloud.
Table of Contents
- Send data to SigNoz Self-hosted with Docker
- Send data to SigNoz Self-hosted with Kubernetes
- What's next
Send data to SigNoz Self-hosted with Docker
In this guide you will install the OTel demo application using Docker and send telemetry data to SigNoz hosted with Docker, referred as SigNoz [Docker] from now.
Prerequisites
- Docker and Docker Compose installed
- 6 GB of RAM for the application [as per OpenTelemetry documentation]
- Nice to have Docker Desktop, for easy monitoring
Clone the OpenTelemetry Demo App Repository
Clone the OTel demo app to any folder of your choice.
# Clone the OpenTelemetry Demo repository
git clone https://github.com/open-telemetry/opentelemetry-demo.git
cd opentelemetry-demo
Modify OpenTelemetry Collector Config
By default, the collector in the demo application will merge the configuration from two files:
- otelcol-config.yml [we don't touch this]
- otelcol-config-extras.yml [we modify this]
To add SigNoz [Docker] as the backend, open the file src/otel-collector/otelcol-config-extras.yml and add the following,
exporters:
  otlp:
    endpoint: "http://host.docker.internal:4317"
    tls:
      insecure: true
  debug:
    verbosity: detailed

service:
  pipelines:
    metrics:
      exporters: [otlp]
    traces:
      exporters: [spanmetrics, otlp]
    logs:
      exporters: [otlp]
The SigNoz OTel collector [sigNoz's otel-collector service] listens at 4317 port on localhost. When the OTel demo app is running within a Docker container and needs to transmit telemetry data to SigNoz, it cannot directly reference 'localhost' as this would refer to the container's own internal network. Instead, Docker provides a special DNS name, host.docker.internal, which resolves to the host machine's IP address from within containers. By configuring the OpenTelemetry Demo application to send data to host.docker.internal:4317, we establish a network path that allows the containerized application to transmit telemetry data across the container boundary to the SigNoz OTel collector running on the host machine's port 4317.
Note: When merging extra configuration values with the existing collector config (
src/otel-collector/otelcol-config.yml), objects are merged and arrays are replaced resulting in previous pipeline configurations getting overridden. The spanmetrics exporter must be included in the array of exporters for the traces pipeline if overridden. Not including this exporter will result in an error.
To send data to SigNoz Cloud
If you want to send data to cloud instead, open the file src/otel-collector/otelcol-config-extras.yml and add the following,
exporters:
  otlp:
    endpoint: "https://ingest.{your-region}.signoz.cloud:443"
    tls:
      insecure: false
    headers:
      signoz-access-token: <SIGNOZ-KEY>
  debug:
    verbosity: detailed

service:
  pipelines:
    metrics:
      exporters: [otlp]
    traces:
      exporters: [spanmetrics, otlp]
    logs:
      exporters: [otlp]
Remember to replace the region and ingestion key with proper values as obtained from your account.
Start the OpenTelemetry Demo App
Both SigNoz and OTel demo app [frontend-proxy service, to be accurate] share common port allocation at 8080. To prevent port allocation conflicts, modify the OTel demo application config to use port 8081 as the ENVOY_PORT value as shown below, and run docker compose command.
ENVOY_PORT=8081 docker compose up -d
This spins up multiple microservices, with OpenTelemetry instrumentation enabled. you can verify this by,
docker compose ps -a
The result should look similar to this,

Navigate to http://localhost:8081/ where you can access OTel demo app UI. Generate some traffic to send to SigNoz [Docker].
Monitor with SigNoz [Docker]
Signoz exposes its UI at http://localhost:8080/. You should be able to see multiple services listed down as shown in the snapshot below.

This verifies that your OTel demo app is successfully sending telemetry data to SigNoz [Docker] as expected.
Send data to SigNoz Self-hosted with Kubernetes
In this guide you will install the OTel demo application using Helm and send telemetry data to SigNoz hosted with Kubernetes, referred as SigNoz [Kubernetes] from now.
Prerequisites
- Helm charts installed
- 6 GB of free RAM for the application [as per OpenTelemetry documentation]
- A kubernetes cluster (EKS, GKE, Minikube)
- kubectl [CLI for Kubernetes]
Note: We will be installing OTel demo app using Helm charts, since it is recommended by OpenTelemetry. If you wish to install using kubectl, follow this.
Install Helm Repo and Charts
You’ll need to install the Helm repository to start sending data to SigNoz cloud.
helm repo add open-telemetry https://open-telemetry.github.io/opentelemetry-helm-charts
The OpenTelemetry Collector’s configuration is exposed in the Helm chart. All additions made will be merged into the default configuration. We use this capability to add SigNoz as an exporter, and make pipelines as desired.
For this we have to create a values.yaml which will override the existing configurations that comes with the Helm chart.
default:
  env:
    - name: OTEL_SERVICE_NAME
      valueFrom:
        fieldRef:
          apiVersion: v1
          fieldPath: "metadata.labels['app.kubernetes.io/component']"
    - name: OTEL_EXPORTER_OTLP_METRICS_TEMPORALITY_PREFERENCE
      value: cumulative
    - name: OTEL_RESOURCE_ATTRIBUTES
      value: 'service.name=$(OTEL_SERVICE_NAME),service.namespace=opentelemetry-demo'
    - name: OTEL_COLLECTOR_NAME
      value: signoz-otel-collector.<namespace>.svc.cluster.local
Replace namespace with your appropriate namespace. This file will replace the chart’s existing settings with our new ones, ensuring telemetry data is sent to SigNoz [Kubernetes].
Note: When merging YAML values with Helm, objects are merged and arrays are replaced. The spanmetrics exporter must be included in the array of exporters for the traces pipeline if overridden. Not including this exporter will result in an error.
To send data to SigNoz cloud
If you wish to send data to cloud instance of SigNoz, we have to create a values.yaml which will override the existing configurations that comes with the Helm chart.
opentelemetry-collector:
  config:
    exporters:
      otlp:
        endpoint: "https://ingest.{your-region}.signoz.cloud:443"
        tls:
          insecure: false
        headers:
          signoz-access-token: <SIGNOZ-KEY>
      debug:
        verbosity: detailed
    service:
      pipelines:
        traces:
          exporters: [spanmetrics, otlp]
        metrics:
          exporters: [otlp]
        logs:
          exporters: [otlp]
Make sure to replace the region and key with values obtained from the account
Now install the helm chart with a release name and namespace of your choice. Let's take my-otel-demo as the release name and otel-demo as the namespace for the context of the code snippet below,
# Create a new Kubernetes namespace called "otel-demo"
kubectl create namespace otel-demo
# Install the OpenTelemetry Demo Helm chart with the release name "my-otel-demo"
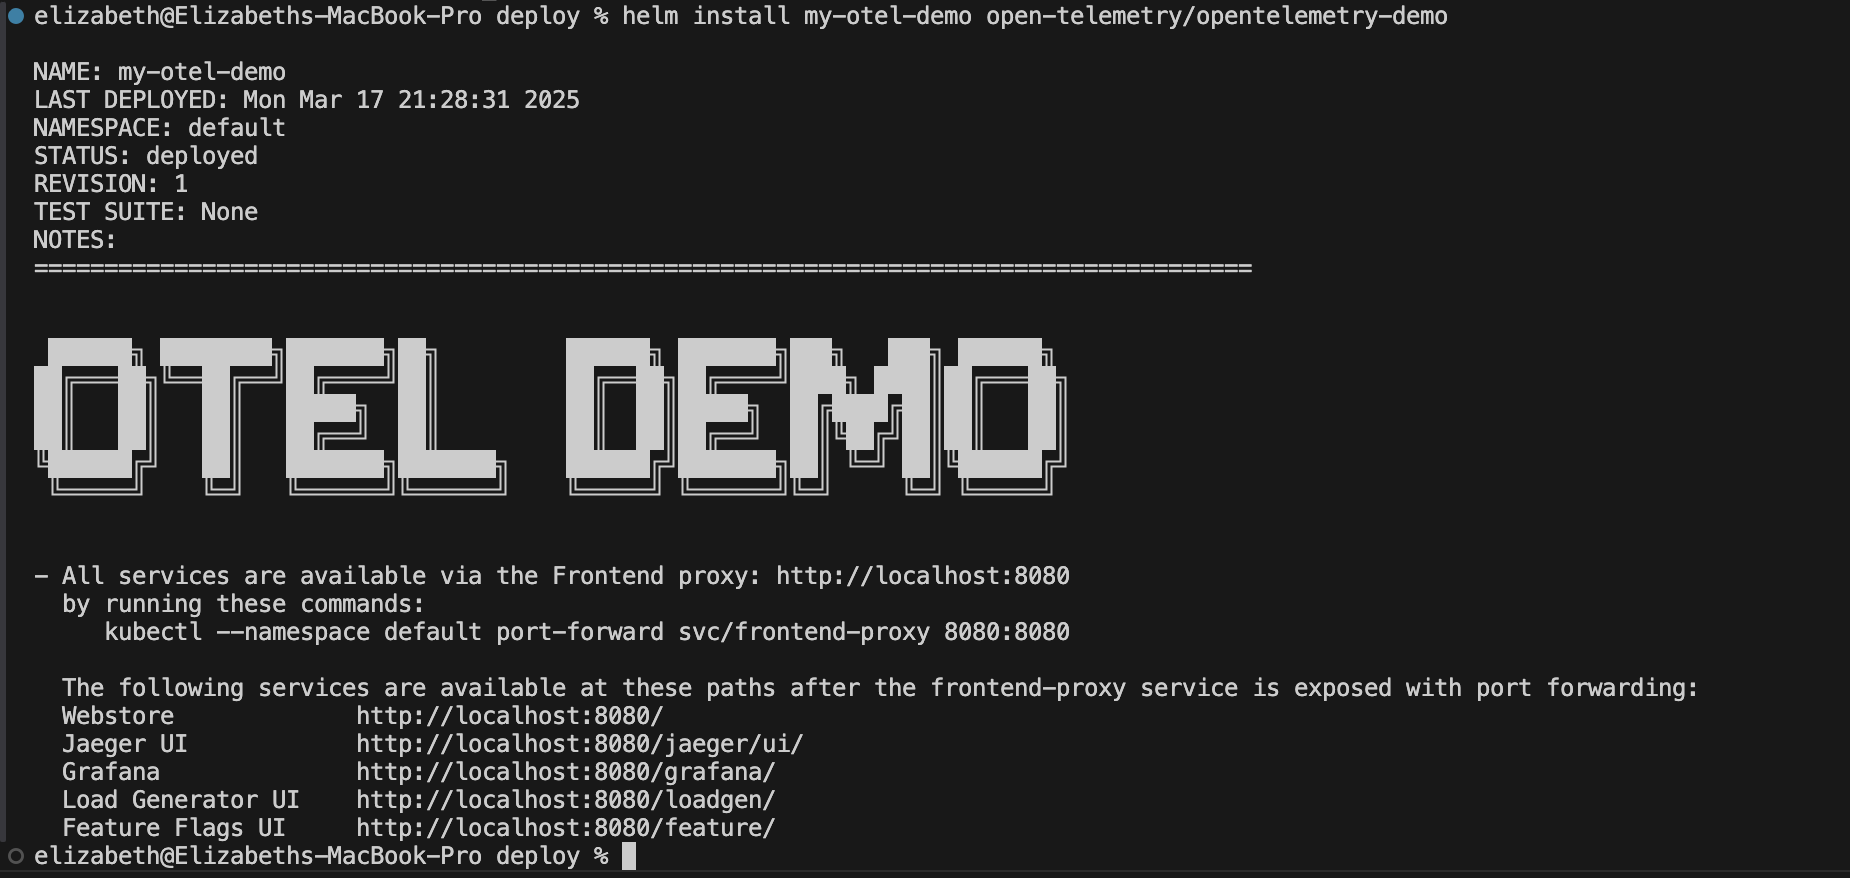
helm install my-otel-demo open-telemetry/opentelemetry-demo --namespace otel-demo -f values.yaml
You should see a similar output on your terminal,
To verify if all the pods are running,
kubectl get pods -n otel-demo
The output should look similar to this,

Start the OpenTelemetry Demo App
To expose the OTel demo app UI [frontend-proxy service] use the following command (replace my-otel-demo with your Helm chart release name):
kubectl port-forward svc/my-otel-demo-frontend-proxy 8080:8081
Navigate to http://localhost:8081/ where you can access OTel demo app UI. Generate some traffic to send to SigNoz [Kubernetes].
Monitor with SigNoz [Kubernetes]
Signoz exposes it's UI at http://localhost:8080/. You should be able to see multiple services listed down as shown in the snapshot below.
This verifies that your OTel demo app is successfully sending telemetry data to SigNoz [Kubernetes] as expected.
What's next?
Don't forget to check our OpenTelemetry track, guaranteed to take you from a newbie to sensei in no time!
Also from a fellow OTel fan to another, we at SigNoz are building an open-source, OTel native, observability platform (one of its kind). So, show us love - star us on GitHub, nitpick our docs, or just tell your app we’re the ones who’ll catch its crashes mid-flight and finally shush all the 3am panic calls!